Unit economics for a $70M manufacturer
A $70 million manufacturer whose finance seat was consumed by cash-flow firefighting and payroll, with nine locations running through one blended set of books. This is the work that gave the owner real numbers.
01 · Where it started
Where it started
The company had been acquired two years earlier, and the person holding the finance seat was too busy managing cash problems and keeping payroll moving to do the work a CFO seat exists for. Nine locations rolled into one set of financials, so nobody could see performance the way the owner needed to see it: by location, and by product. And this isn't a $70 million problem; blended books hide margins exactly the same way at $8 million.
02 · The work, mapped
The work, mapped to what it served
Six workstreams, in the order they landed. Big dot = that work materially served that outcome.
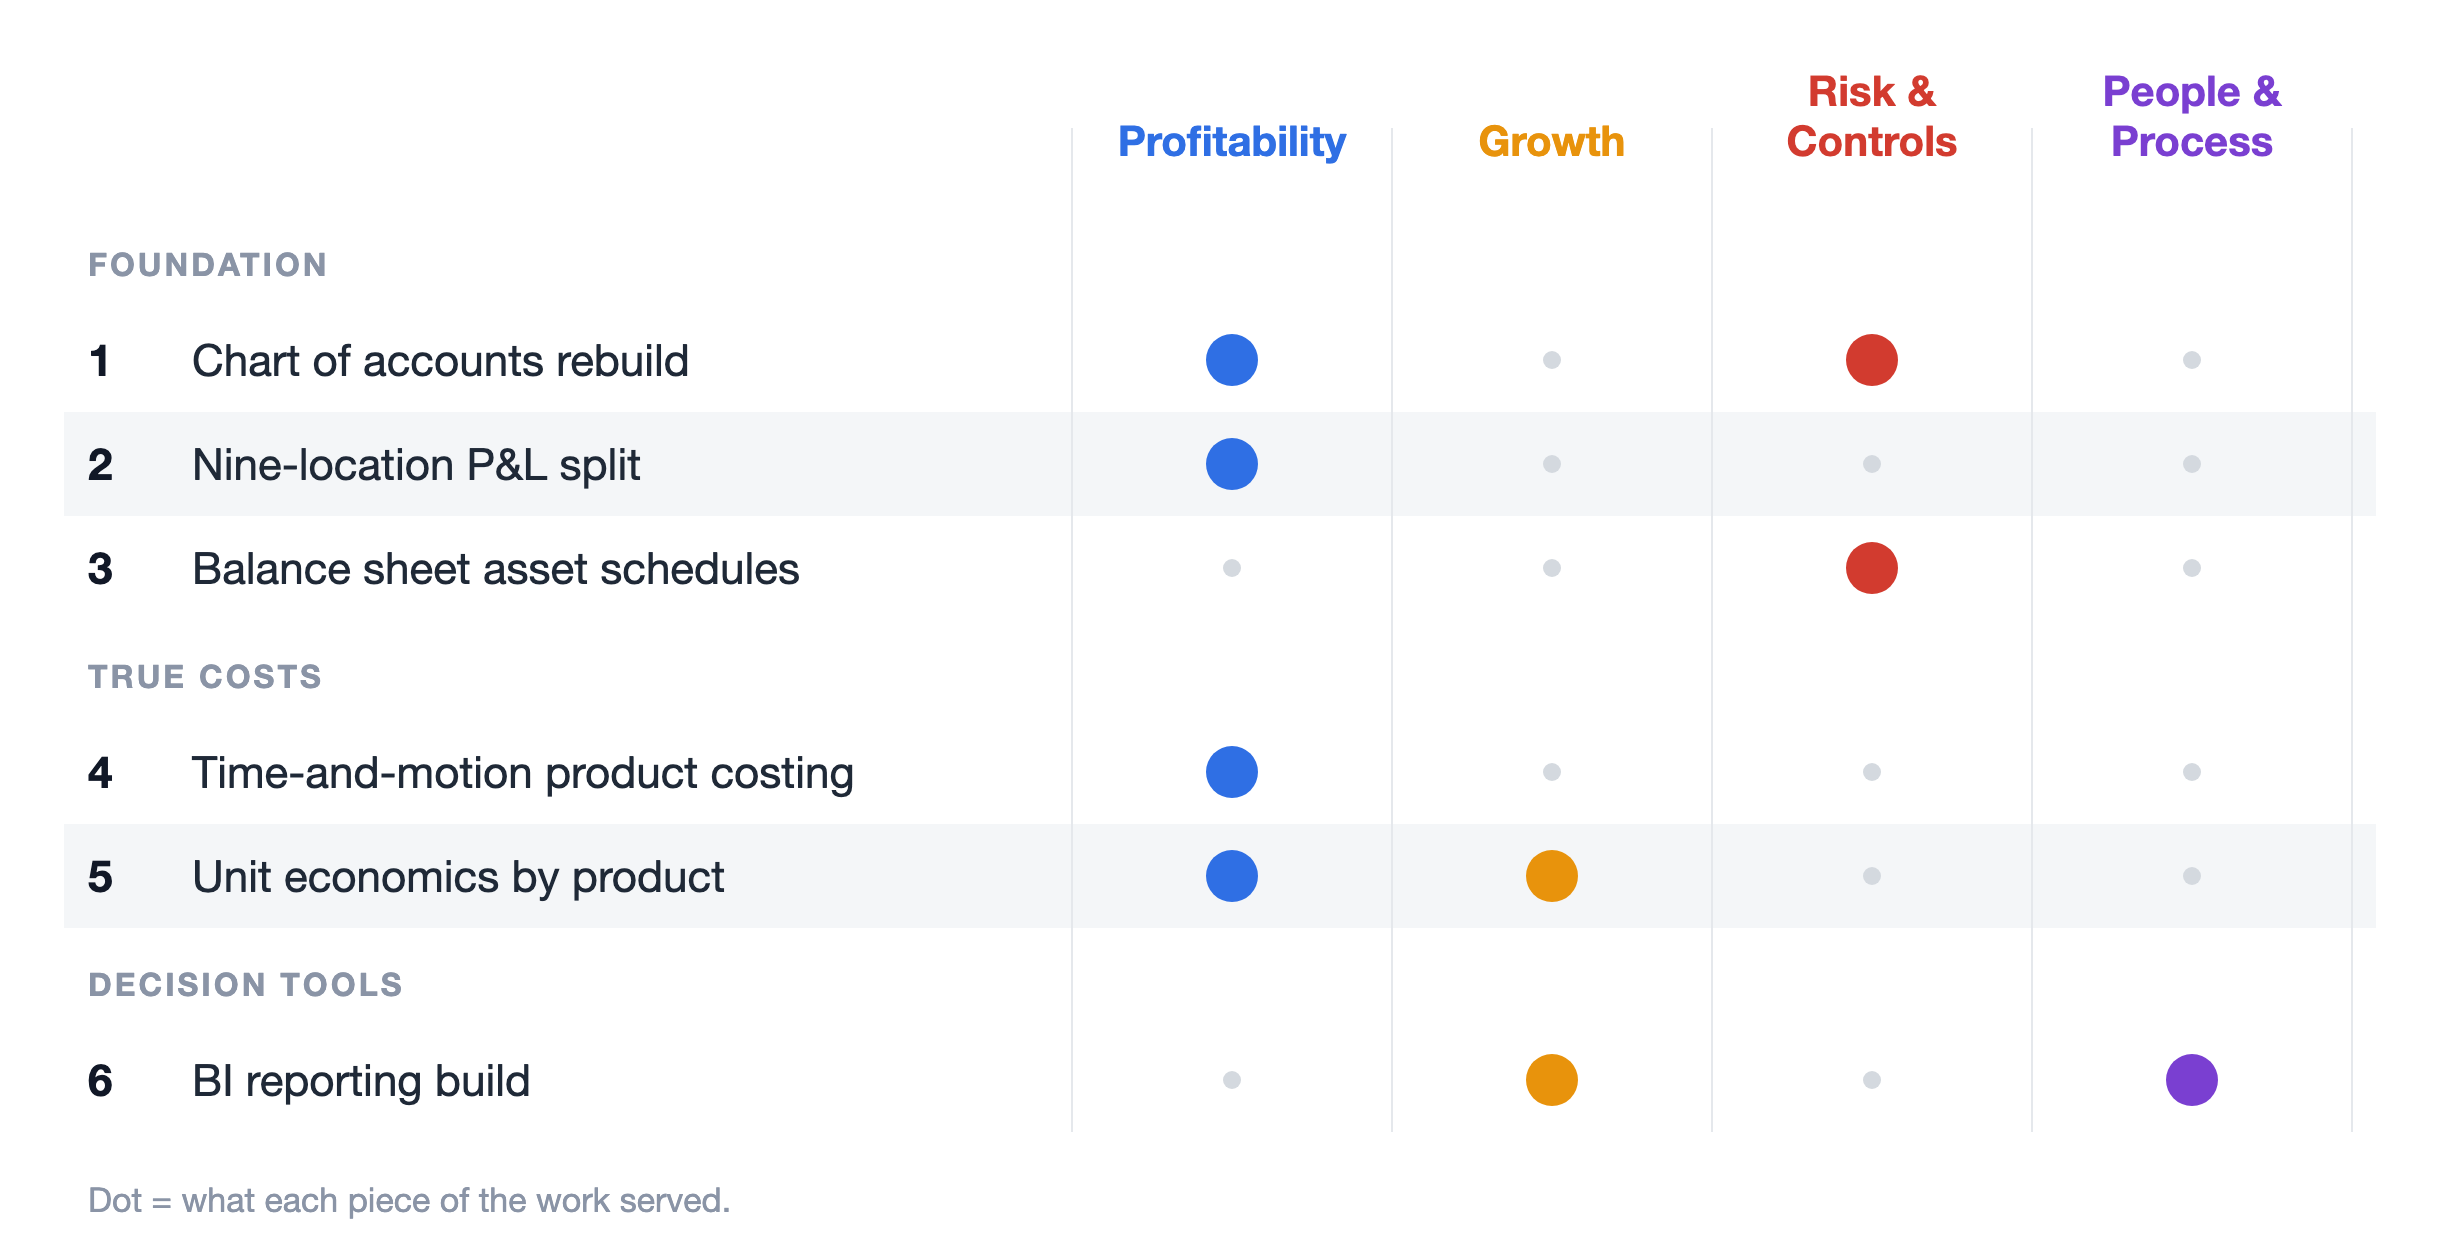
Foundation
- 01
Chart of accounts rebuild
You can't see nine businesses through a chart of accounts built for one. The rebuild gave every location and product line a place for its numbers to land.
- 02
Nine-location P&L split
One blended P&L became nine, so each location's performance stands on its own instead of hiding in the average.
- 03
Balance sheet asset schedules
Every asset on the balance sheet, scheduled and supported. That is the difference between a balance sheet a bank trusts and one it asks questions about.
True costs
- 04
Time-and-motion product costing
We measured what it actually takes to make each product, on the floor, not from a spreadsheet assumption. After that, the product costs were real numbers instead of guesses.
- 05
Unit economics by product and location
With real costs in hand, contribution margin by product and by location became a number the owner can act on: what to push, what to reprice, what to stop making.
Decision tools
- 06
BI reporting build
The analysis became a living view of the business rather than a one-time study, so the questions the owner asks every month get answered from current data.
04 · What changed
What changed
The owner now knows contribution margin by location and by product, with insight into the business's performance at a depth they hadn't had since acquiring it two years earlier. In the time since the work began, the company has added $10 million in new revenue growth. I won't claim the numbers did that on their own; growth has many parents. What I claim is that the owner finally made decisions while seeing what each one cost and returned.
Straight answers
Questions owners ask
What does product-level costing actually involve?
Watching the work happen. Time-and-motion costing means measuring what each product actually consumes in labor, machine time, and material, then carrying those real costs into the P&L. It's slower than allocating overhead by a percentage, and it's the reason the margins hold up when a buyer or a banker tests them.
We have multiple locations and one P&L. Where do you start?
The chart of accounts. Splitting a P&L by location only works if the accounts underneath can carry the split. Rebuild the foundation first and the location and product views stop being a quarterly spreadsheet project and start being how the books just work.
Cash is the bigger fire right now. Does this still apply?
That was true here too; the finance seat was consumed by cash firefighting. The 13-week cash forecast in the Margin Map exists for exactly that, and it buys the room to fix costing properly instead of between emergencies.
The engagement
What the Margin Map actually is
Three weeks, $7,500 flat, for owner-operated companies in the $5 to $50 million range. You get your P&L rebuilt by provider, location, or line, a 13-week cash forecast, and a ranked opportunity list with a dollar value and the math behind every item. If your books are already clean, the same three weeks get spent the way a buyer's diligence team would spend them: testing what you'd have to defend. I need read access to your books, three to four hours of your time across the three weeks, and a few hours from whoever runs the numbers today. If you have a controller or an office manager holding things together, they're an asset to this work, not its subject; I work through them, not around them, and the heavy data pulls get scheduled around your season, not on top of it. The Map either identifies at least three times its fee in margin opportunity, or you don't pay. Most owners keep me on to work the opportunity list; how that works is on the Margin Map page.
Find out what each product actually makes
The Margin Map starts the same way this engagement did: rebuild the P&L so it shows where margin actually lives, then rank the fixes by dollar value.