Case study · Medical practice
One practice, five providers, and a P&L rebuilt down to cost per case
This is the Command Center Method inside a multi-provider vascular and interventional practice in the Pacific Northwest. Every number on this page traces to project records. Nothing is rounded up, estimated, or invented.
The numbers, verified against project records
1,986
cases analyzed
5
providers
50
months of history
16 → 46
CPT codes, Jan 2026 transition
0
duplicate rows on re-upload
25/25
acceptance tests passing
As with everything on this page, these six numbers trace to project records.
01 · The practice
The practice
The practice has five providers, 1,986 cases in its case tracker, and roughly 50 months of operating history running from March 2022 through April 2026. It carries a busy clinical calendar, growing case volume, and financials that totaled everything into one bucket.
02 · The problem
The problem
The practice could see total revenue and total cost. What it couldn't see was profit per provider or cost per case, and in a multi-provider practice that's where the real story lives. Then it got harder: on January 1, 2026, the arterial CPT code set changed from 16 codes to 46. A practice that couldn't analyze margin under 16 codes was going to have a much harder time under 46.
03 · What I built
What I built
- 01A P&L by provider, with cost attribution down to the individual case.
- 02CPT-level margin analysis with arterial-code grouping that handles the January 2026 transition from 16 codes to 46.
- 03A provider filter on the CPT analysis, so any single provider's case mix can be examined on its own.
- 04Case-tracker ingest that reads the practice's own xlsx export straight into the dashboard, with no re-keying and no manual imports.
- 05Upload management with per-file deletion. Before this, fixing one bad upload meant wiping all the data and starting over.
04 · The build, on one page
The build, on one page
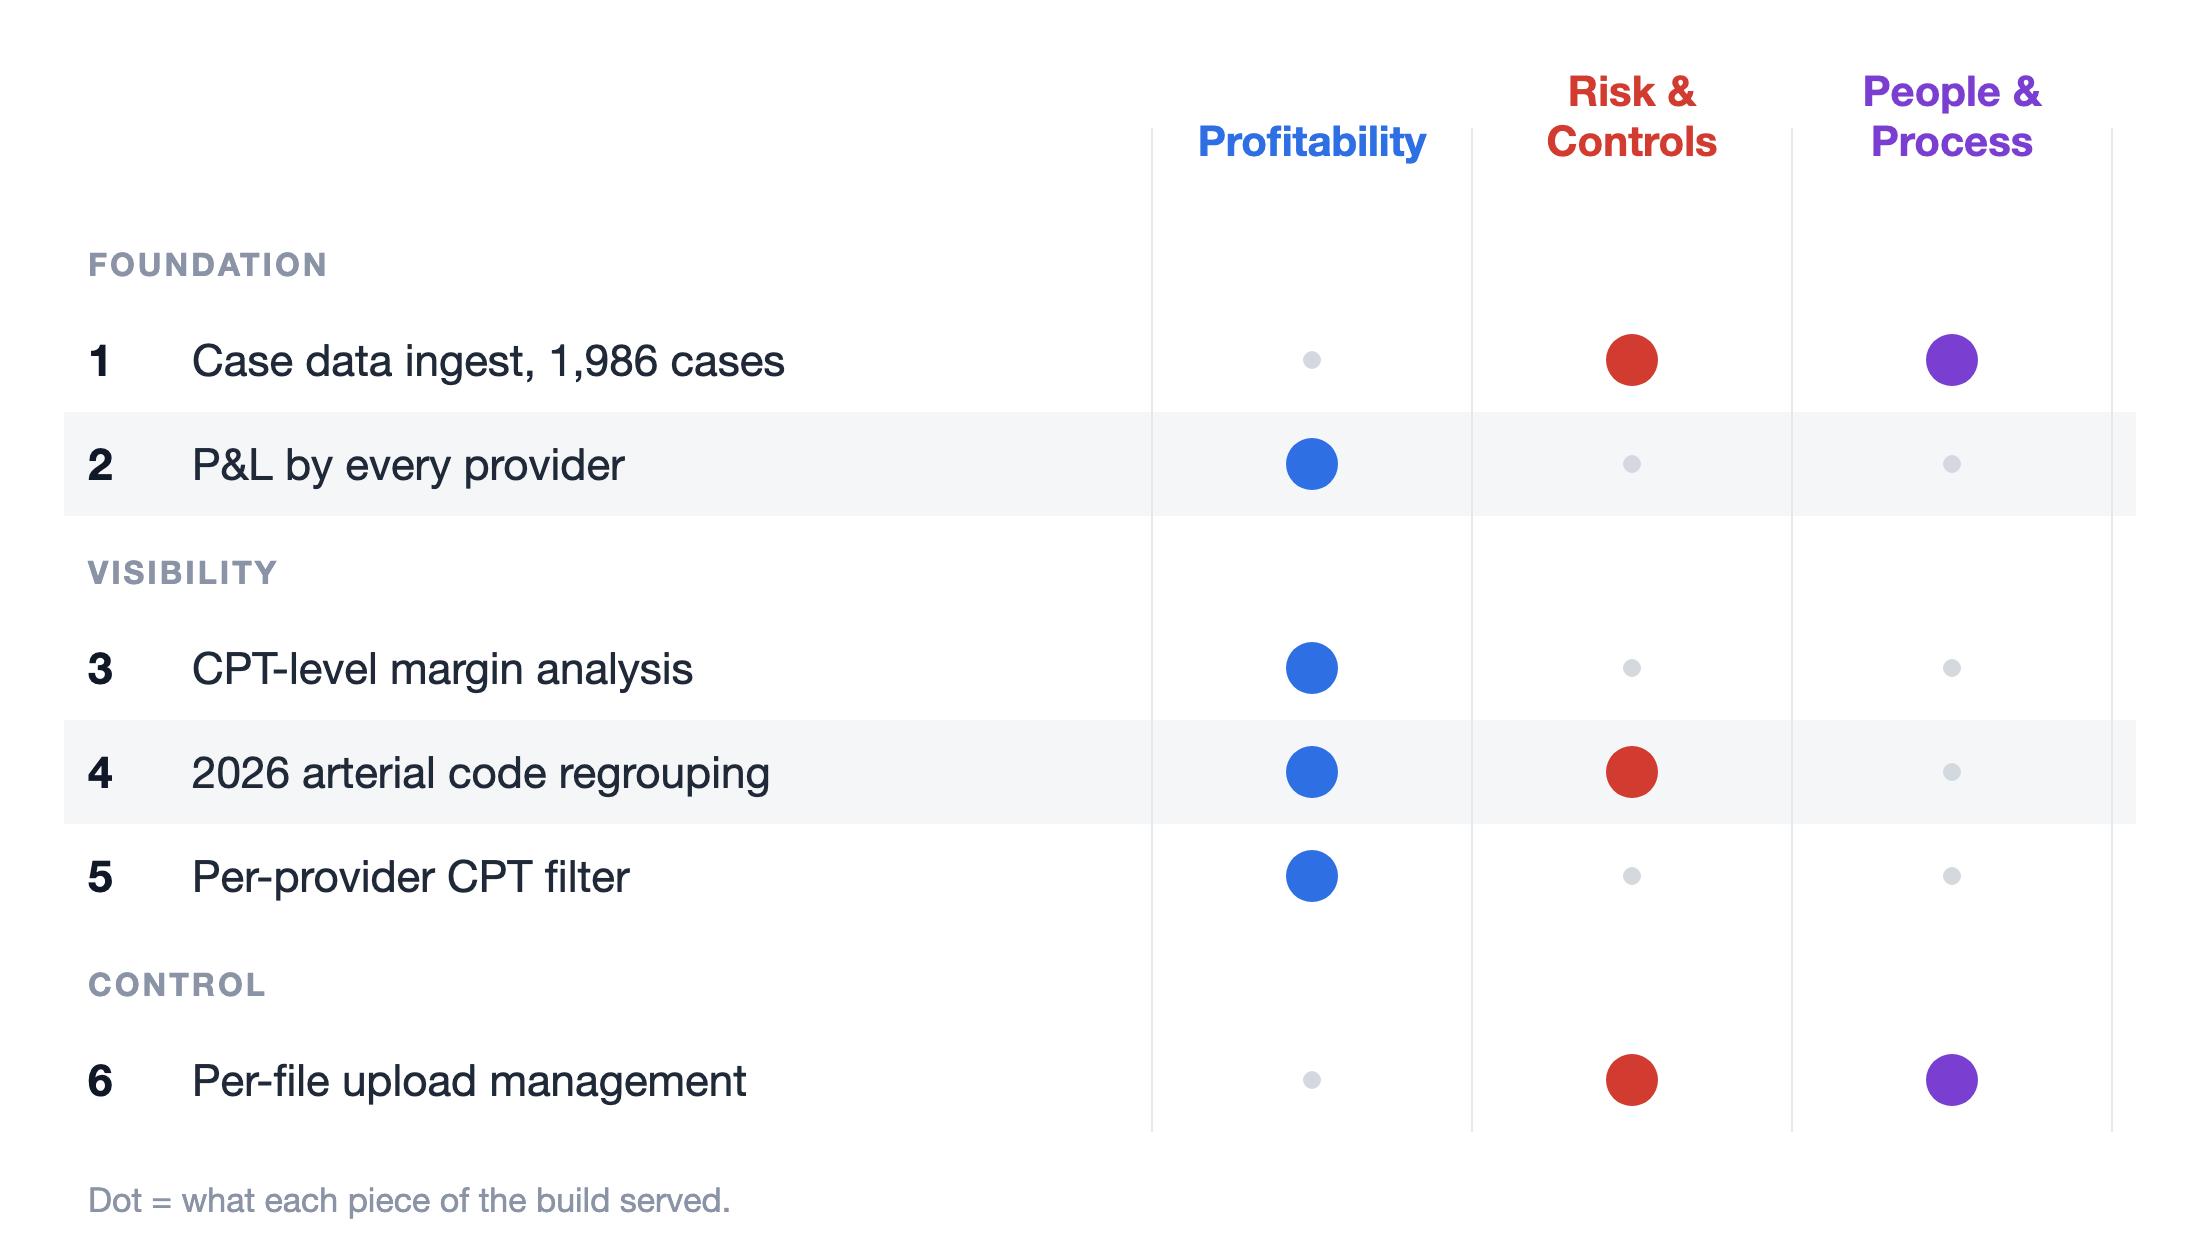
This is the value map for the engagement: each piece of the build, in the order it landed, mapped to the outcome it served. It's the same one-page discipline I bring to client reports.
05 · A working view
What a Command Center looks like
This is the layout an owner checks weekly: the handful of numbers that drive margin, profit by provider, and where cash is headed over the next 13 weeks. The values below are illustrative. A client's command center runs on their real data, and that data stays private.
Gross margin
38.4%
trailing 12 months
Cash on hand
$412K
as of Friday close
13-week low point
$118K
week 9, covered
Monthly close
Day 6
books closed and tied out
Profit by provider
margin after direct cost, trailing 12 months
13-week cash forecast
projected end-of-week cash balance
Multi-location groups get the same build. Providers become locations, and every site gets benchmarked against the group on one page.
Revenue per location vs system median
trailing 12 months, all 8 units
06 · The output
What an opportunity list looks like
Every Margin Map ends in a ranked opportunity list. The dollar values on a real one belong to the client, but the categories repeat across engagements, and these are the ones the list quantifies most often.
On a real opportunity list, every one of these lines carries a dollar value with the math shown: the assumption, the source number, and the annualized impact. Those dollar values belong to the client, which is why you won't find them here.
Underpriced services or jobs
Work priced below what it actually costs to deliver once every direct cost is attributed to it.
Unbilled and under-coded work
Cases or jobs that were performed but never billed, or billed under a code that pays less than the work supports.
Comp structures misaligned with margin
Compensation plans that pay for volume while the margin comes from somewhere else.
Payer or customer mix drift
A revenue mix that has slid toward the least profitable payers or customers without anyone deciding it should.
Vendor terms and cost creep
Supplier pricing, renewals, and small recurring charges that ratchet up because nobody owns watching them.
Cash timing
Collections that lag the work by months, and payment terms that give cash away on both sides of the ledger.
What I won't claim
You won't find a made-up savings number on this page, and that's deliberate. The project records verify what was built and that it works, but they don't contain an audited dollar outcome, so I don't quote one. I hold my own marketing to the same standard I'll hold your opportunity list to: every number needs a source I can show you.
07 · Beyond medicine
Built to survive diligence
The same discipline that rebuilt this practice's P&L is the discipline a buyer's diligence team looks for. Across more than 40 engagements with owner-operated companies, as fractional CFO, operations consultant, and deal support, I've turned P&Ls too summarized to show where margin lives into numbers that hold up under scrutiny. One owner grew from $3 million to $10 million in revenue and exited at 10x EBITDA. On five closed sales I sat as the sell-side CFO, building the recast P&Ls and roll-forwards that survived diligence. If you ever sell your practice, that is the bar your numbers will face, and getting there starts years before the offer.
Your practice, mapped the same way
The Margin Map is the first 3 weeks of exactly this kind of work: your P&L rebuilt by provider, location, and line, a 13-week cash forecast, and an opportunity list with a dollar value on every item.