Case studies
Real engagements from my desk, told plainly, for owner-operated companies in the $5 to $50 million range. Client names stay private, and every number traces to the engagement record. Where I can't verify a number, you won't see one.
The record behind them
5
closed sales as sell-side CFO
$400M+
largest client served as fractional CFO
$3M to $10M
one home-services client's growth, then a 10x EBITDA exit
Three facts told at the ceiling I can verify: five closed transactions where I sat as sell-side CFO, a fractional CFO seat covering unit economics and working capital inside a manufacturer doing over $400 million in revenue, and a home-services client I guided from $3 million to $10 million in revenue and through a 10x EBITDA exit. The seats have included home services, healthcare, and manufacturing.
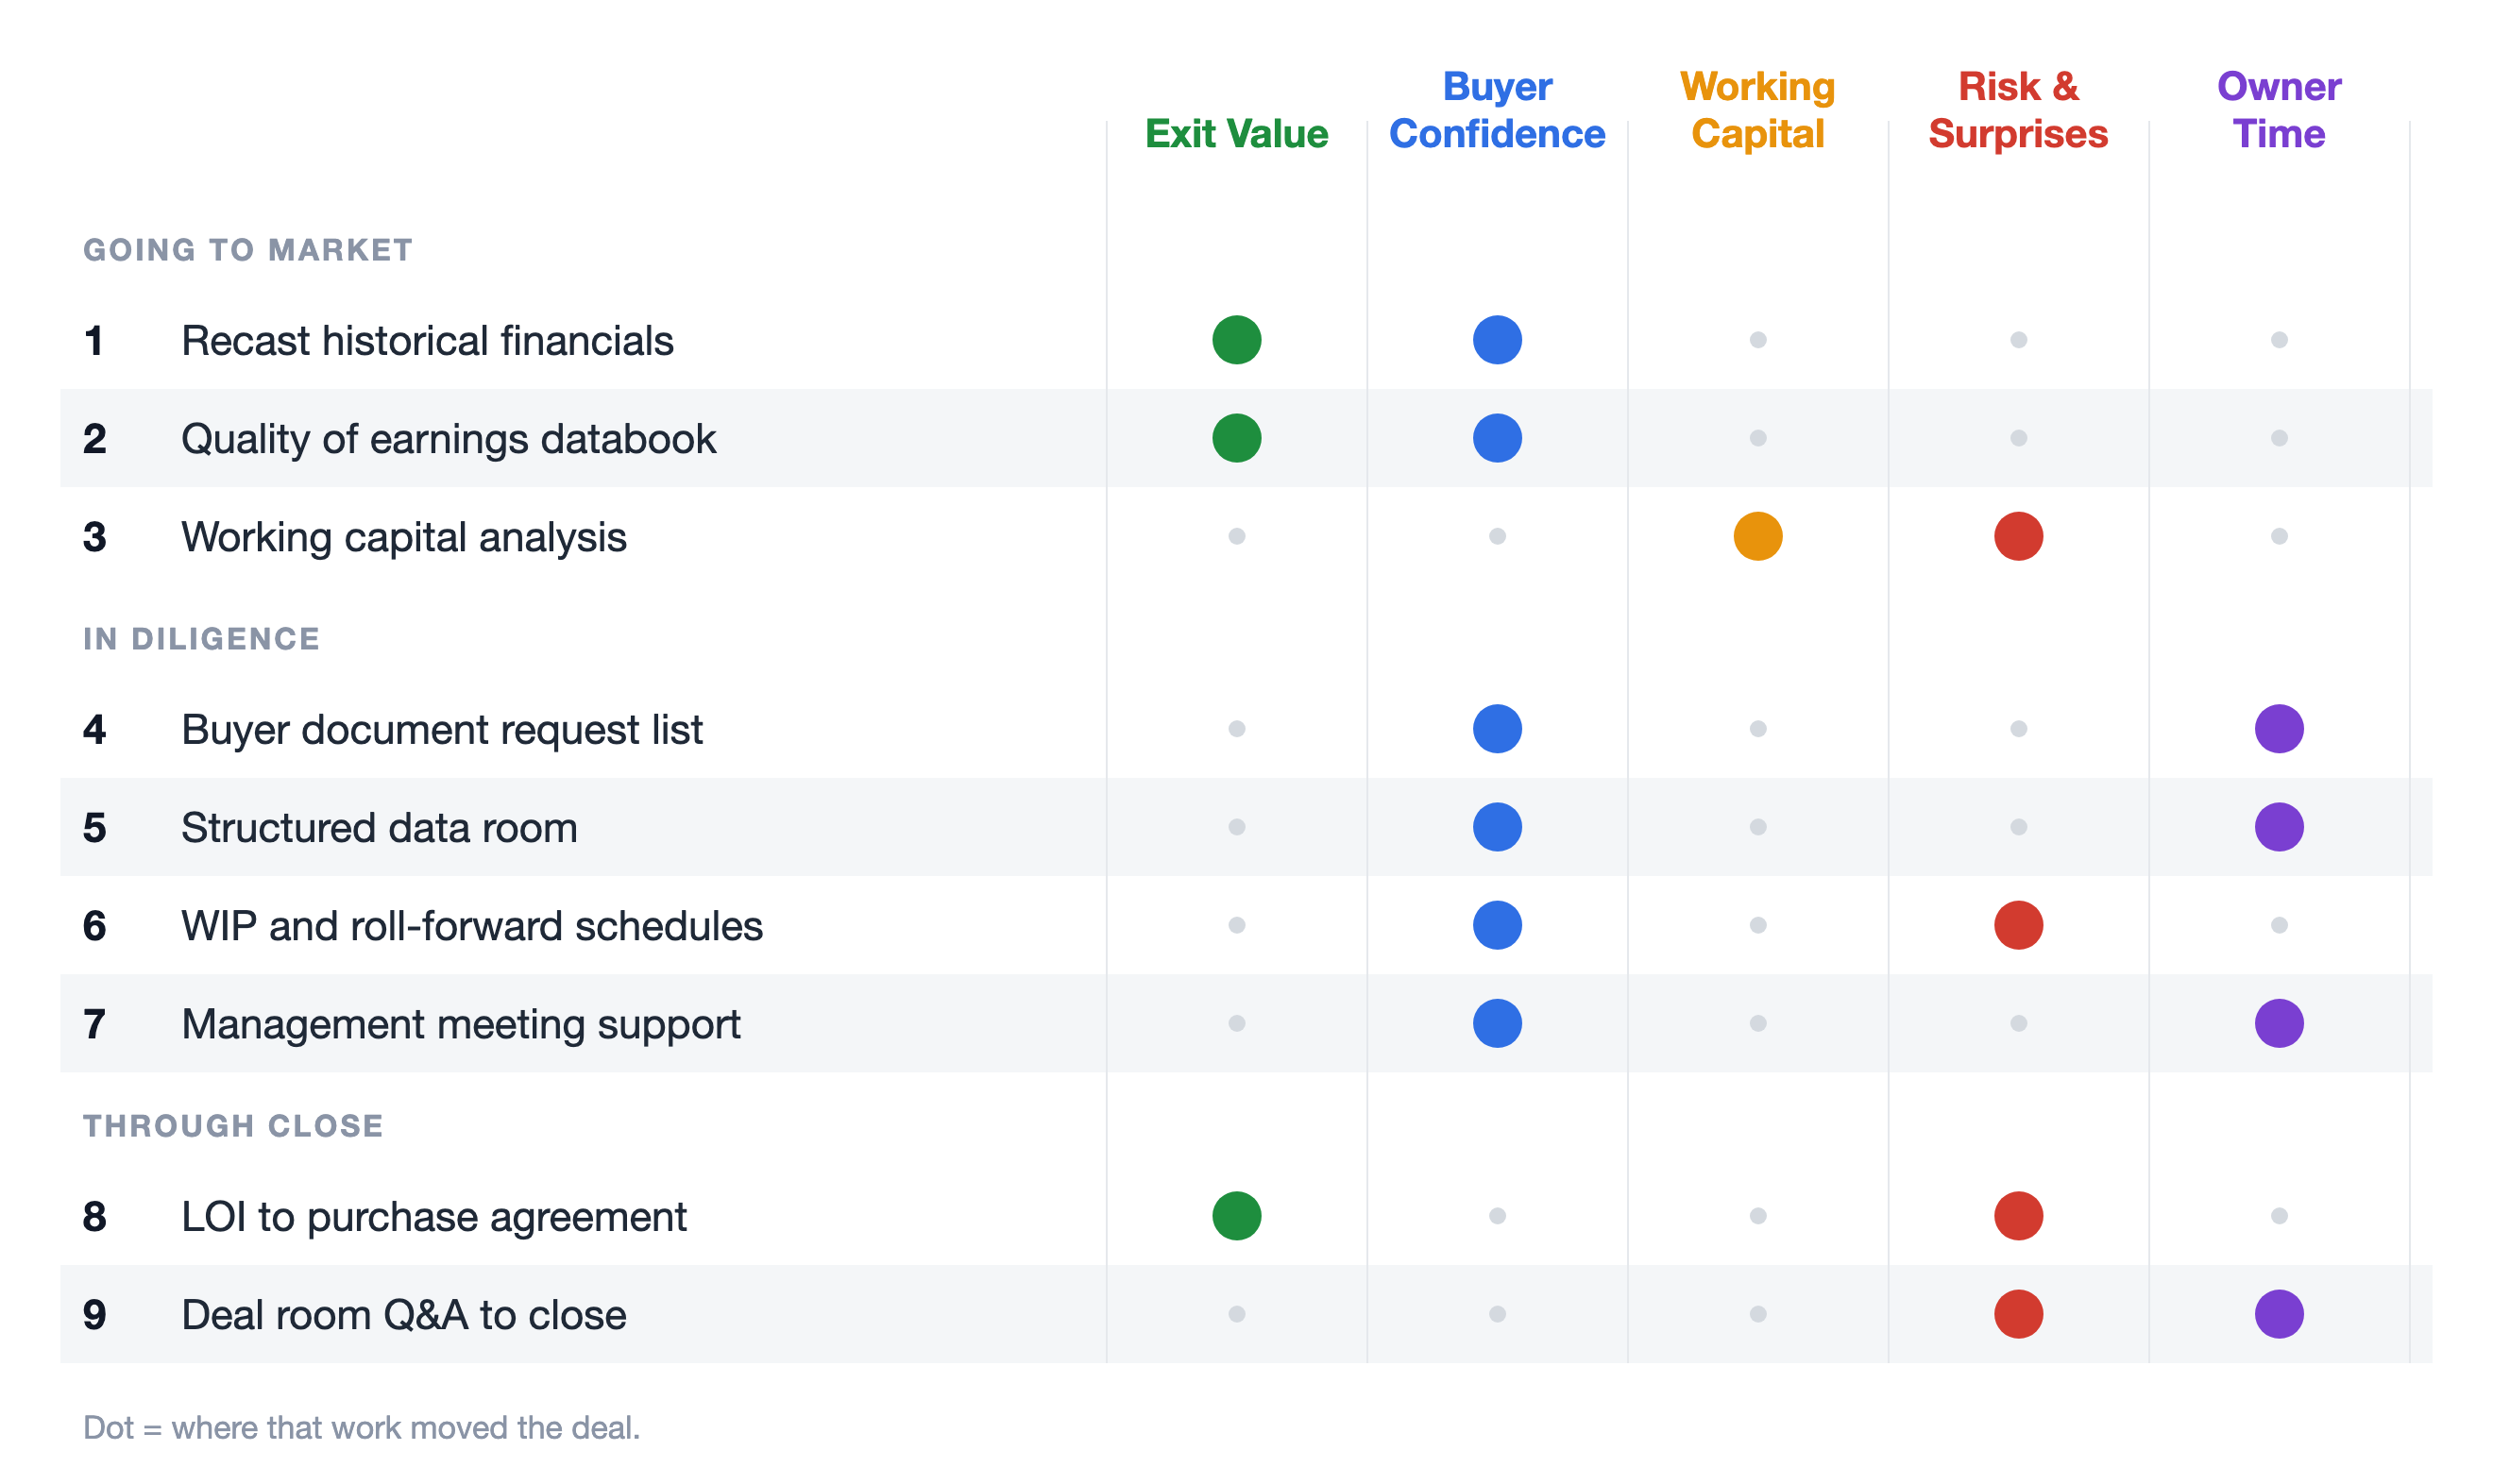
Selling a company
Preparing a business for sale
What a sell-side CFO actually does, from recast financials to the wire clearing. The work behind five closed transactions, mapped phase by phase.
Read the case study →
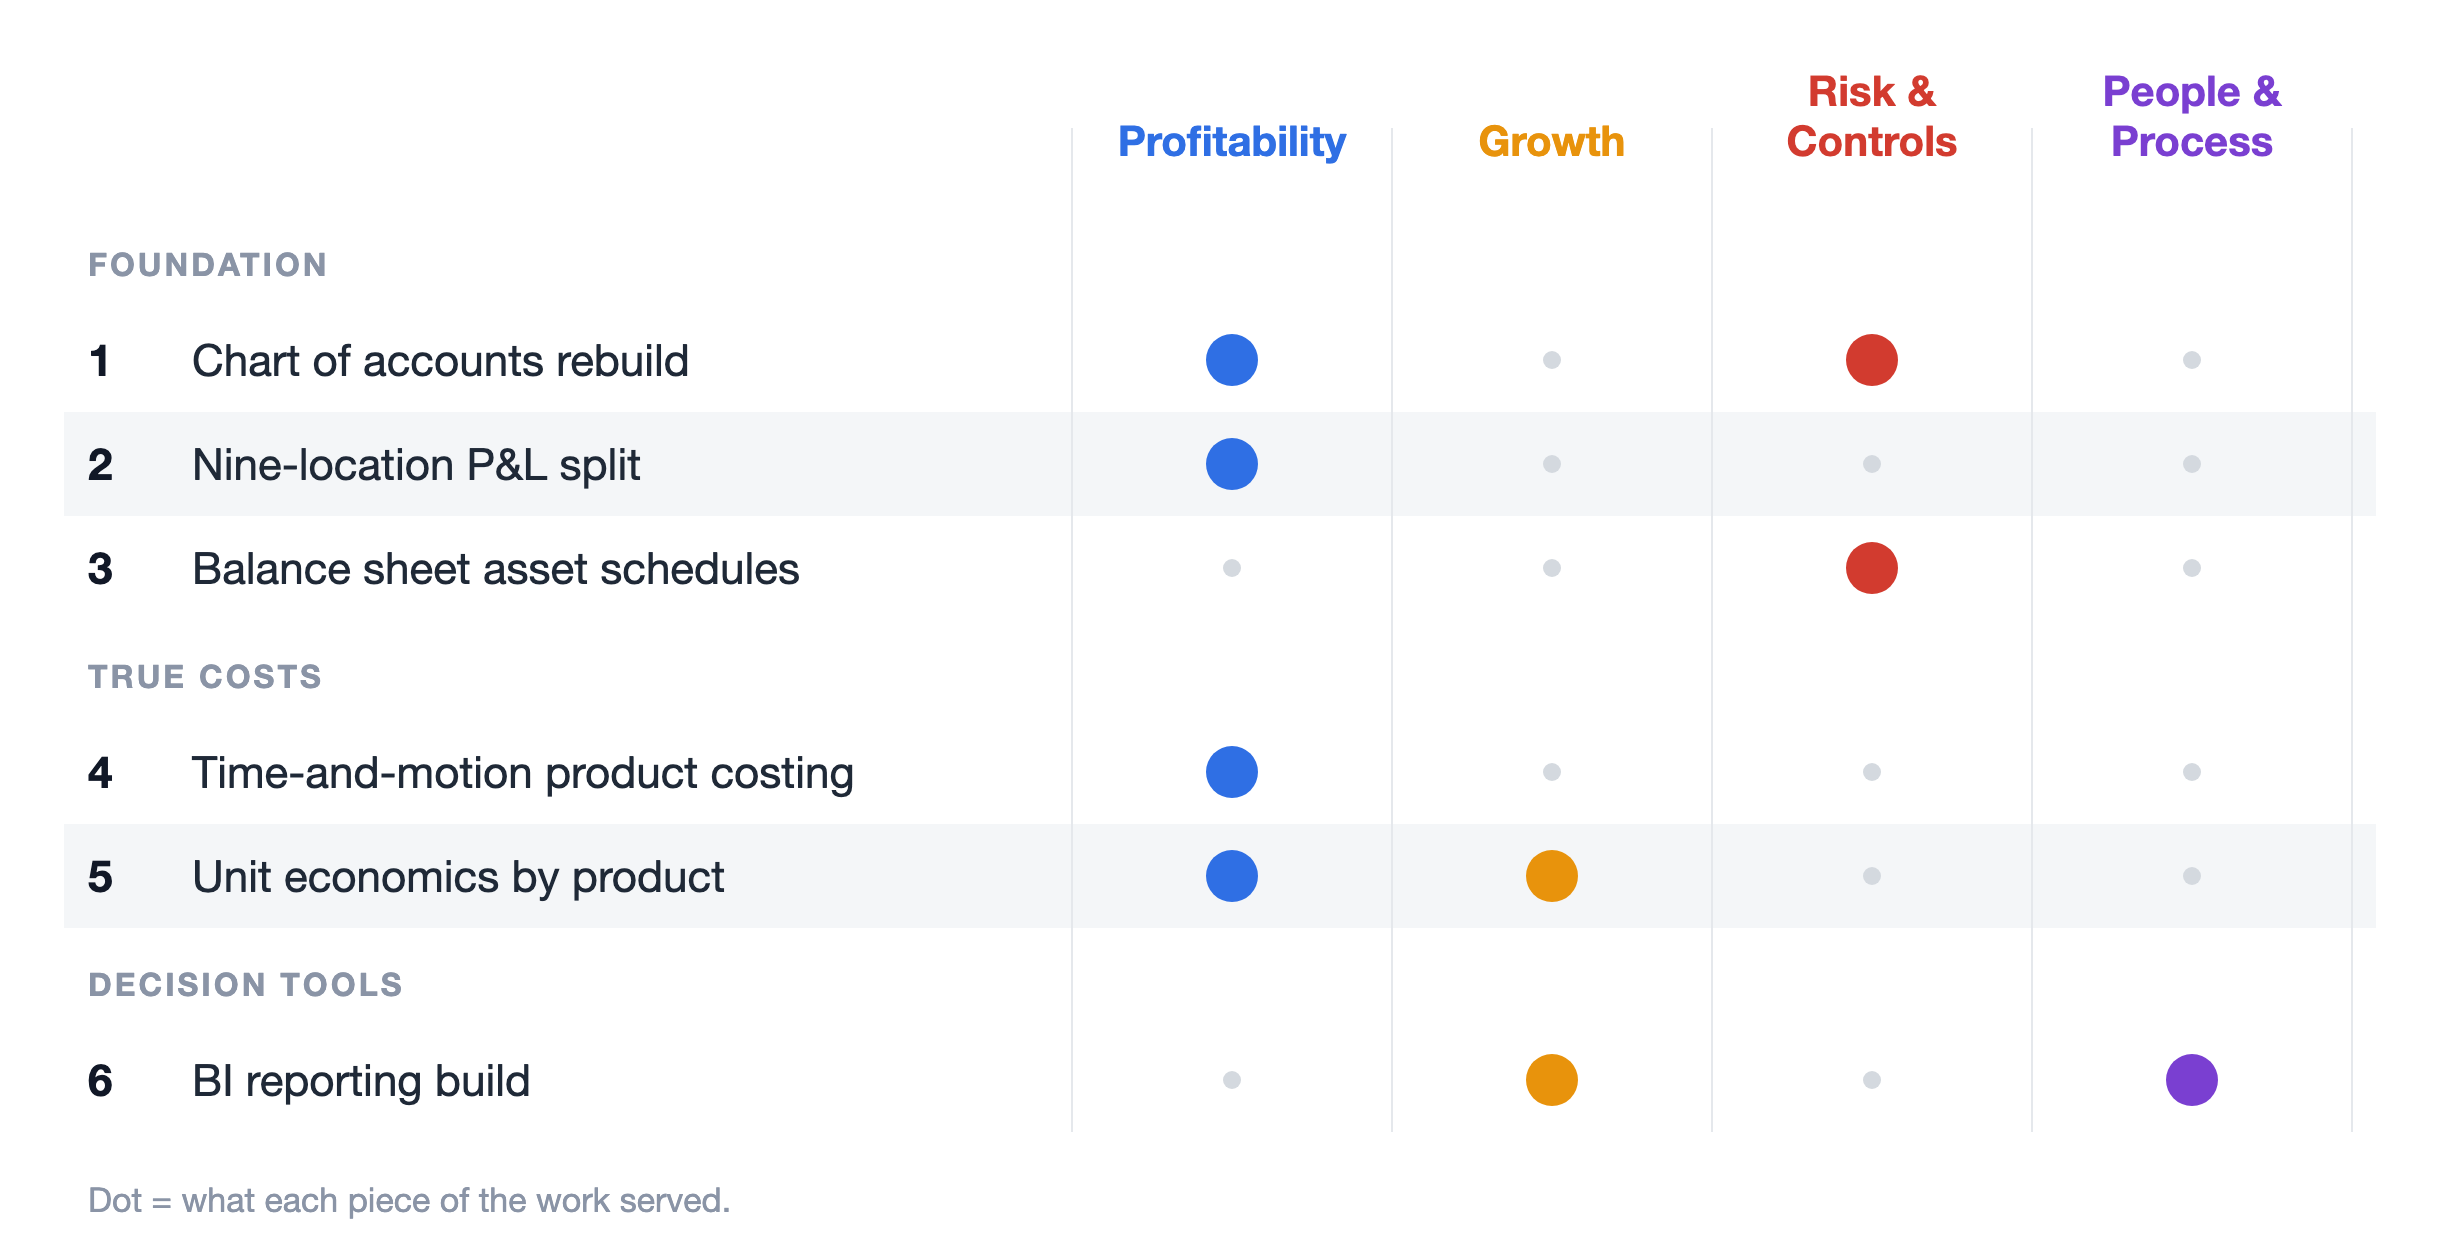
Manufacturing
Unit economics for a $70M manufacturer
Nine locations, one blended set of books, and a finance seat consumed by cash-flow firefighting. The work that put contribution margin by location and product in front of the owner.
Read the case study →
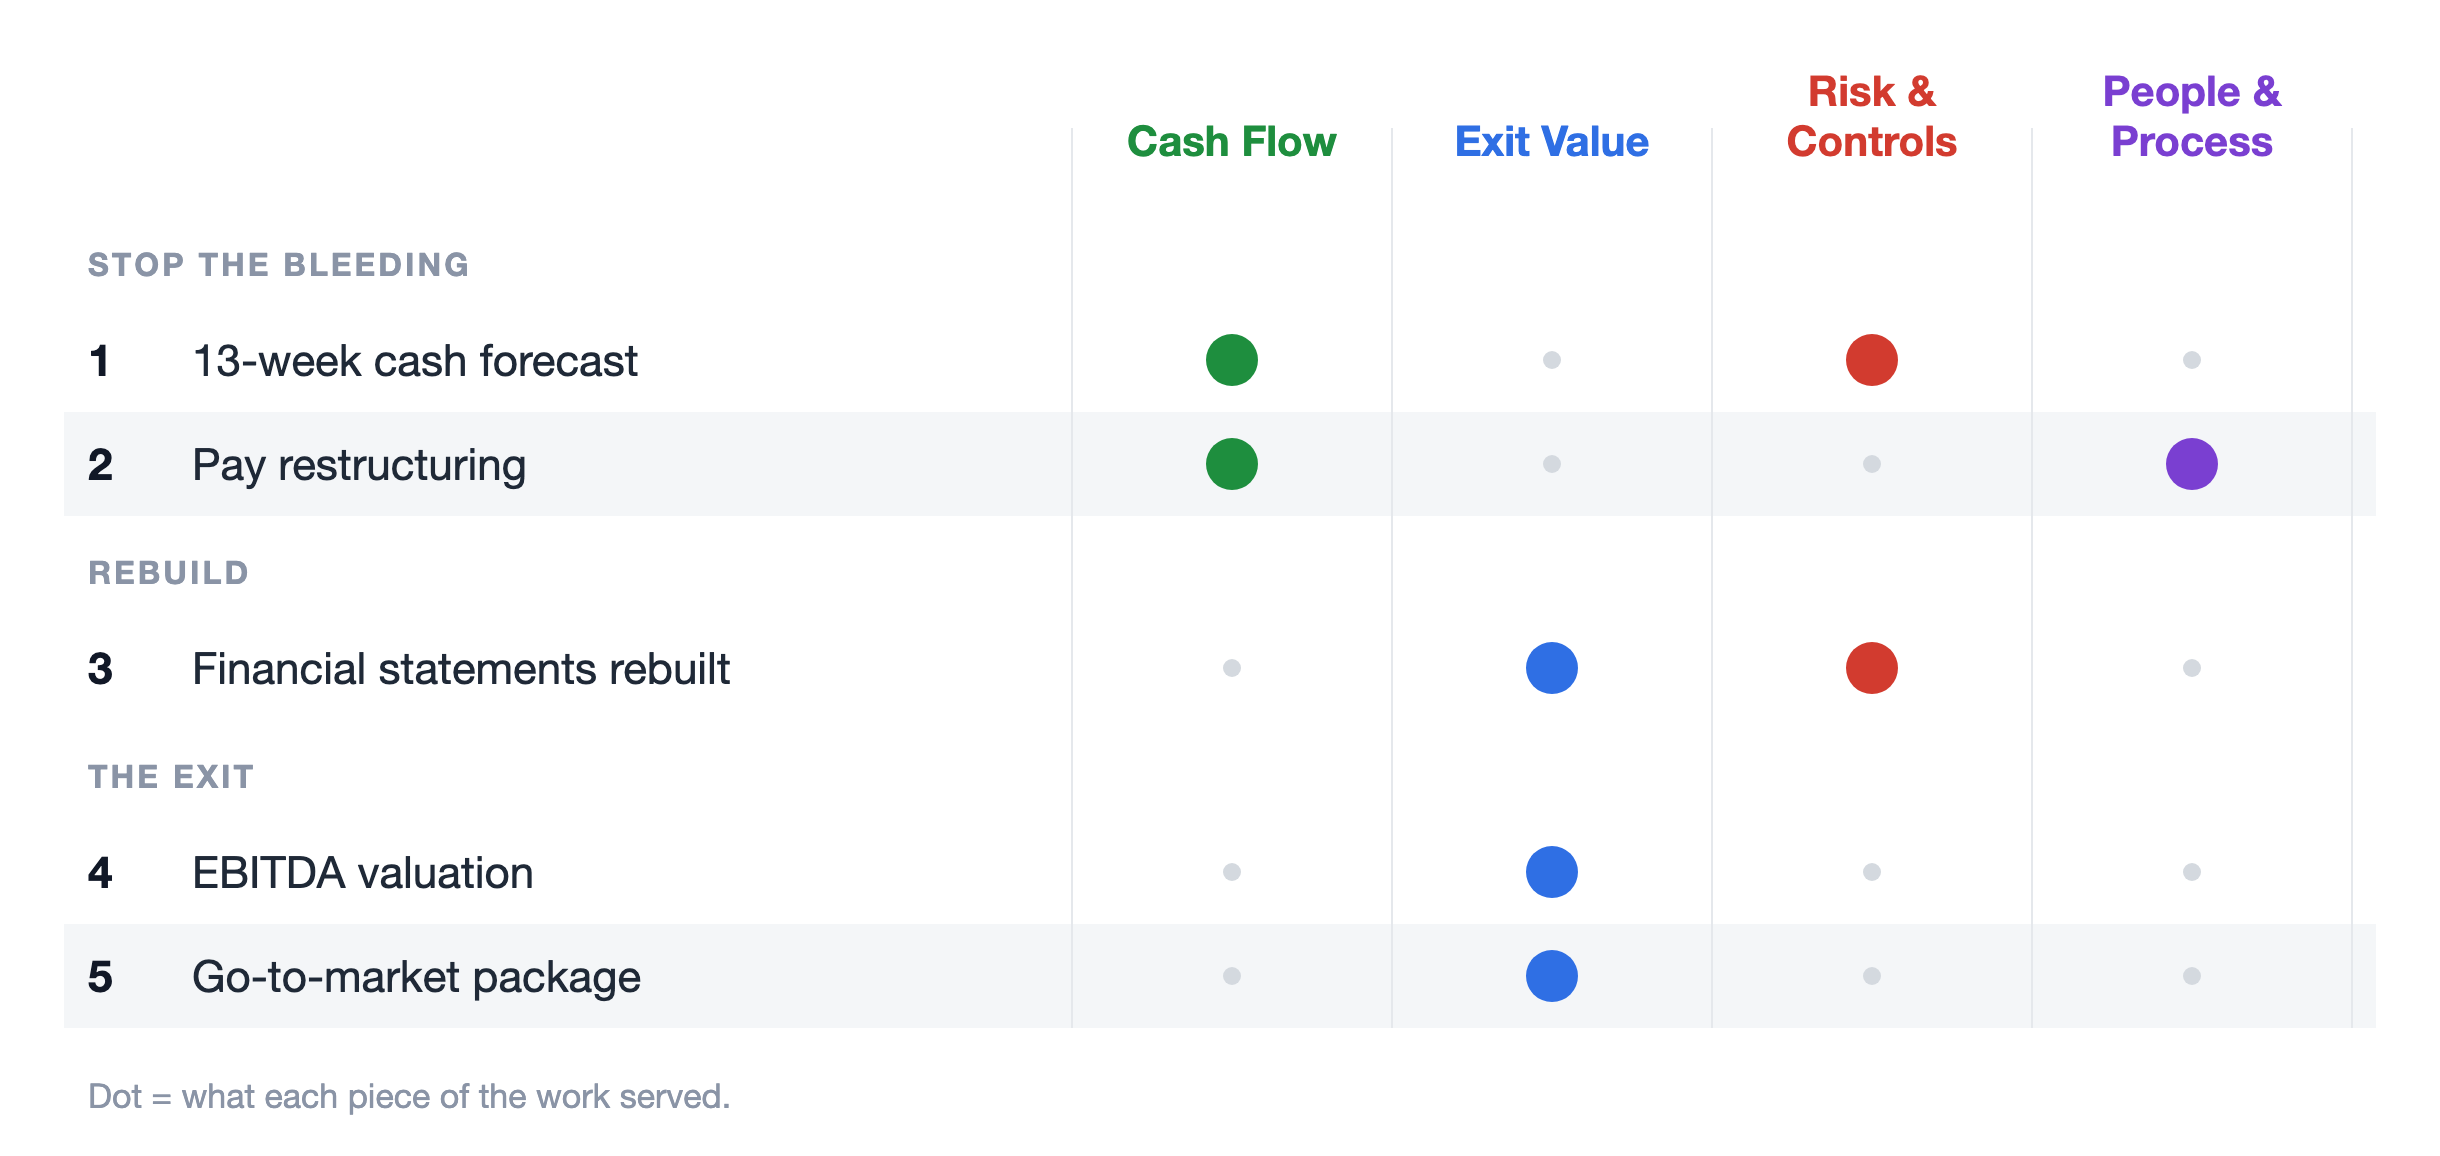
Healthcare and exit
A primary care practice's turnaround and exit
Losing money every month, no cash reserves, an owner ready to walk away. A 13-week cash forecast, restructured pay, rebuilt financials, and a completed sale.
Read the case study →
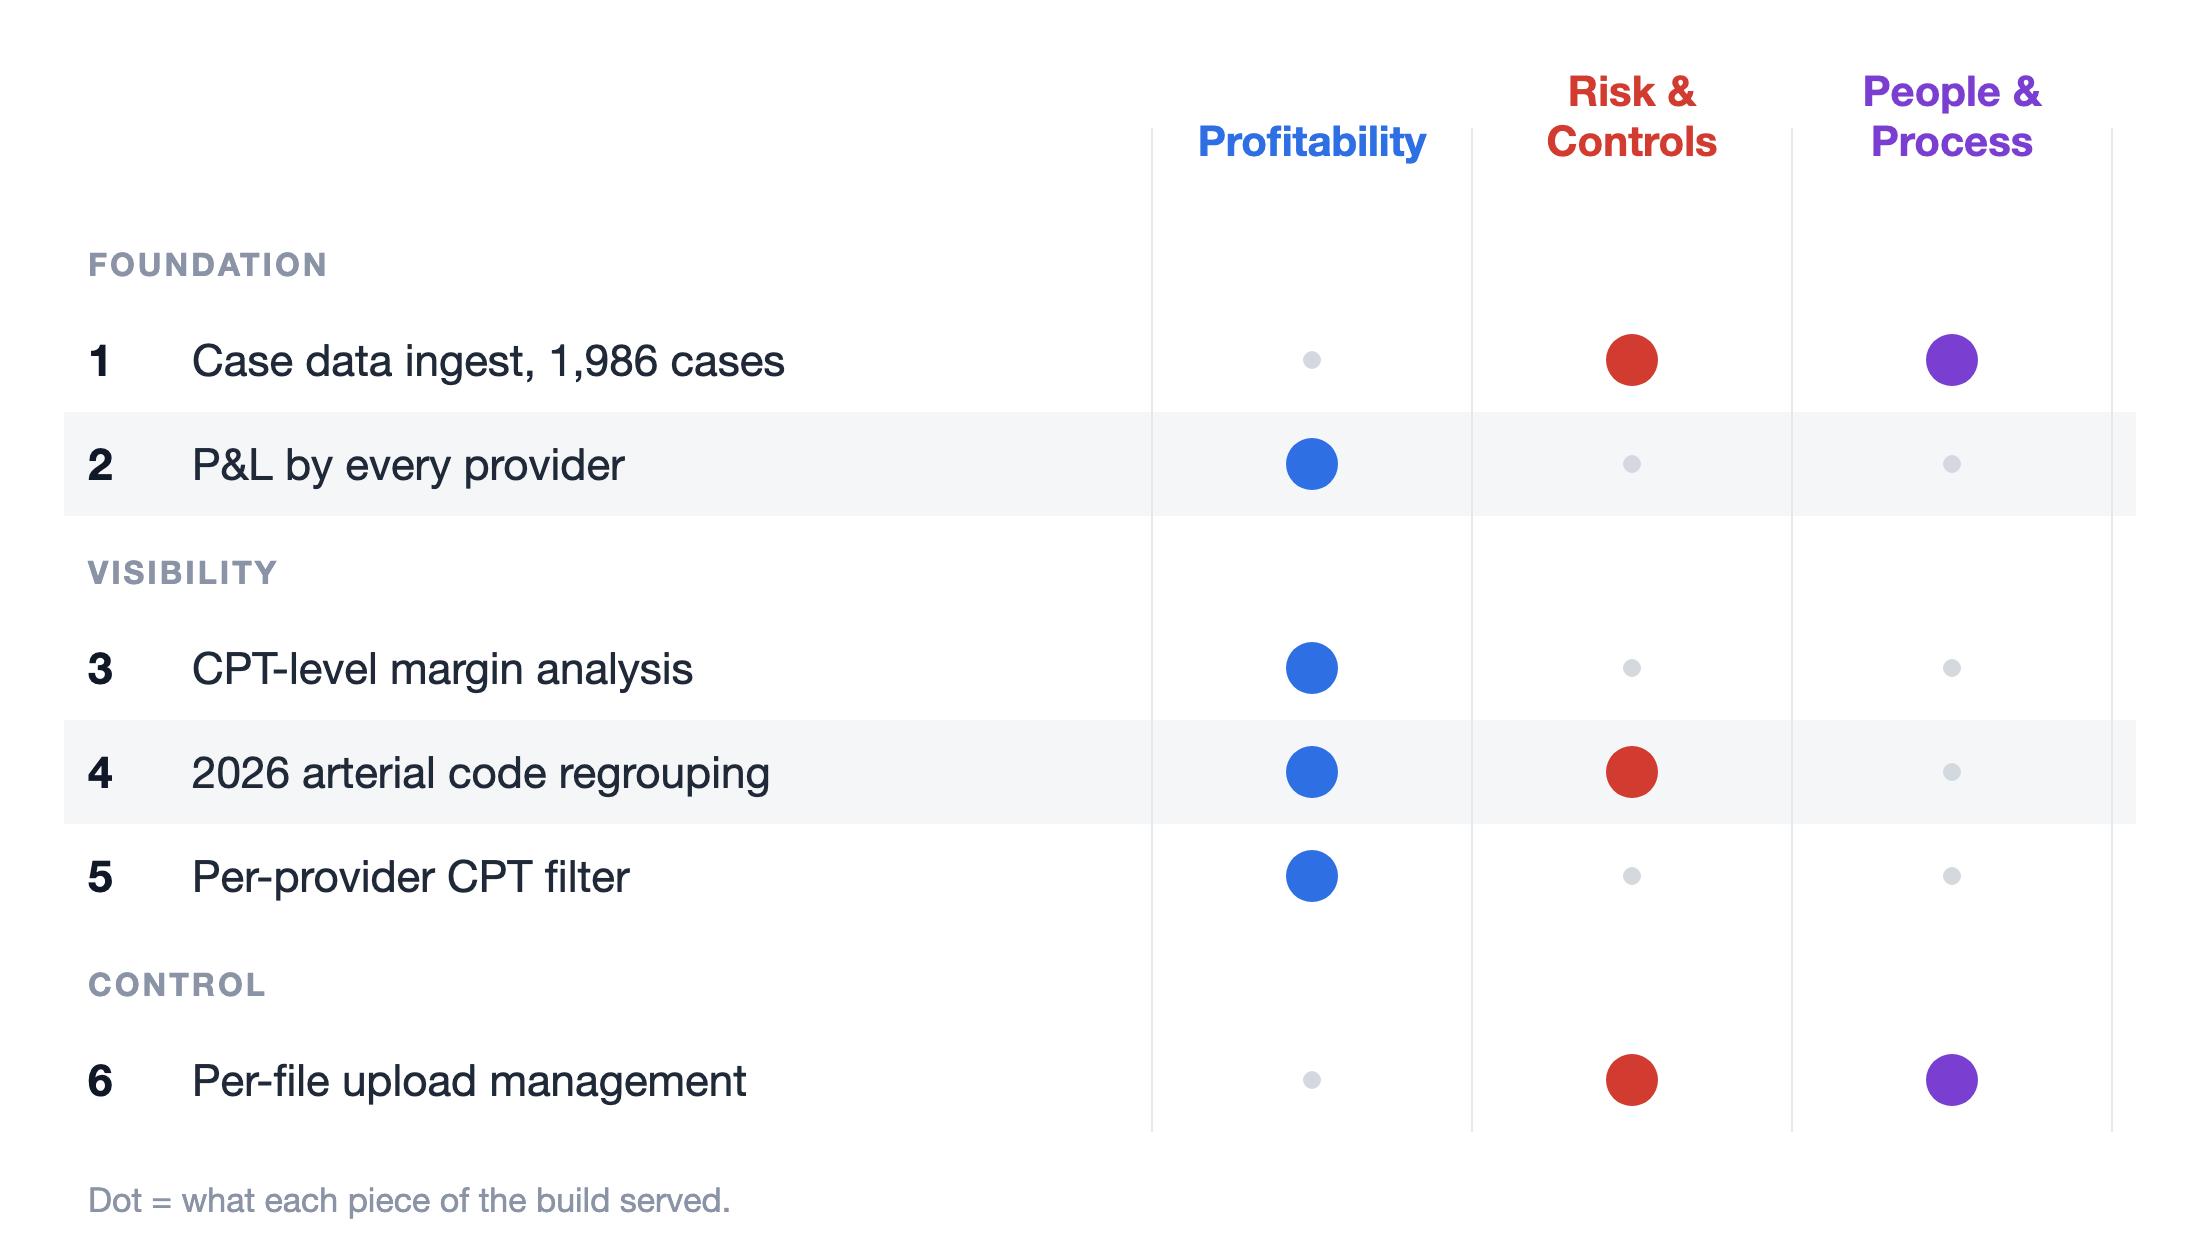
Healthcare
Profitability by provider in a medical practice
Five providers, 1,986 cases, and a P&L rebuilt down to cost per case, with CPT-level margin analysis built for the January 2026 code transition. The data ingest was tested against the practice's real file: zero duplicate rows on re-upload, 25 of 25 automated tests passing.
Read the case study →
How to read a value map
Each case study includes a value map. Rows are the work delivered, in the order the engagement ran. Columns are the outcomes that mattered to the owner. A big dot means that piece of work materially moved that outcome. It's the same one-page discipline I bring to client reports: if a dot can't be justified from the engagement record, it comes off the map. The case studies show the longer arc of an engagement; the three-week Margin Map is the first pass that starts each one.
What the Margin Map actually is
Three weeks, $7,500 flat, for owner-operated companies in the $5 to $50 million range. You get your P&L rebuilt by provider, location, or line, a 13-week cash forecast, and a ranked fix list with a dollar value and the math behind every item. If your books are already clean, the same three weeks get spent the way a buyer's diligence team would spend them: testing what you'd have to defend. I need read access to your books, three to four hours of your time across the three weeks, and a few hours from whoever runs the numbers today. If you have a controller or an office manager holding things together, they're an asset to this work, not its subject; I work through them, not around them, and the heavy data pulls get scheduled around your season, not on top of it. The Map either identifies at least three times its fee in margin opportunity, or you don't pay. Most owners keep me on to work the fix list; how that works is on the Margin Map page.
Your engagement would start the same way
Every case study on this page started with the same move: numbers solid enough to run the company on. That first move is the Margin Map.